A pseudocolored image of the calcium
concentrations reached below the membrane. Notice the correlation of the
red color with the zones of higher channel density. Each successive image
corresponds to the calcium levels at the end of each of the constant calcium
pulses (0.4 pA of unitary current) in a train of stimulation consisting
of 5 (10 ms) pulses delivered at 18Hz. Each image gives the averaged
calcium concentrations in a time interval of 0.09 ms (approximately)
47 channels
25 channels
Figure 2
Similarly as in Fig 1, but for a single constant pulse of 0.08
pA of unitary current and 47 channels (left); right figure: 0.15
pA of unitary current and 25 channels. In both cases the duration of the
pulse is 50 ms. Notice than the whole current is similar for both
animations The successive shots represent average calcium concentrations
at the times: 2ms, 4ms,...,50ms.
time resolution 0.03ms
time resolution 0.1ms
Figure 3
Comparison of Fig. 2 (right) with the same simulation but with a time
resolution of 0.03ms
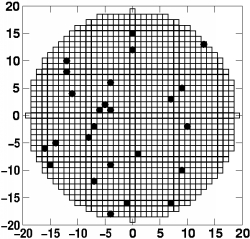
distance(channel,center) <0.8 microns
random and unrestricted distribution of channels
Figure 4
Comparison of Fig. 2 (left) with a similar simulation but with a channel
distributions in which all channels lie closer than 0.8 microns to the center